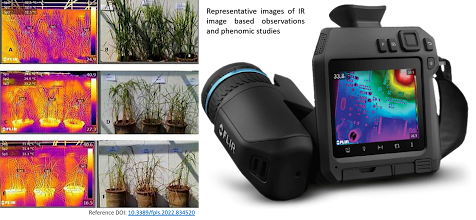
IR Data: Evaluation of Rice Genotypes and Mutants for Drought Tolerance Using Infrared (IR) Imaging
Principle of the Method
Infrared (IR) imaging evaluates plant temperature and water status by detecting thermal radiation emitted from plant surfaces. Plants under drought stress often exhibit increased canopy temperatures due to reduced transpiration caused by stomatal closure. By analyzing IR images, differences in canopy temperature, water-use efficiency, and drought stress responses among rice genotypes, varieties, and mutants can be quantified.
Methodology
-
Setup of IR Imaging
- Use a thermal infrared camera to capture canopy temperature data during the vegetative and reproductive stages.
- Conduct imaging under clear skies during midday (10:00 AM to 2:00 PM) to minimize environmental variability.
-
Data Collection
- Capture IR images for all genotypes and mutants in well-watered (WW) and drought-stressed (DS) conditions.
- Record concurrent environmental parameters, such as air temperature, relative humidity, and solar radiation, for normalization.
-
Image Analysis
- Process IR images using thermal imaging software to extract average canopy temperature for each plot.
- Normalize temperature readings based on environmental conditions and calculate the crop water stress index (CWSI) for each genotype.
-
Supplementary Measurements
- Measure stomatal conductance and relative water content (RWC) to correlate physiological responses with IR data.
- Validate thermal data with leaf temperature measured using a portable infrared thermometer.
Expected Output
-
Canopy Temperature Analysis
- Identification of genotypes with lower canopy temperatures under drought stress, indicating better cooling through transpiration.
- Categorization of mutants into tolerant and sensitive groups based on thermal profiles.
-
Crop Water Stress Index (CWSI)
- Calculation of CWSI for each genotype/mutant to quantify the degree of drought stress experienced.
- Genotypes with low CWSI values will be identified as drought-tolerant.
-
Trait Association
- Correlation between canopy temperature and yield, water-use efficiency, and physiological traits (e.g., RWC and stomatal conductance).
- Identification of traits contributing to drought resilience through thermal data.
-
Ranking of Genotypes and Mutants
- A ranked list of genotypes and mutants based on their ability to maintain lower canopy temperatures and higher drought tolerance indices.
- Insights into genetic and phenotypic variability in drought response.
-
Visualization
- Heat maps and temperature distribution charts for a clear graphical representation of drought stress impacts across genotypes.
Applications of the Output
- Guide breeding programs to select drought-tolerant genotypes and mutants.
- Enhance understanding of physiological mechanisms underlying drought resilience.
- Develop predictive models for field-scale drought monitoring and management.


No comments:
Post a Comment